 FEATURED
Application Development & Modernization
Uplift enterprise IT with cloud-native modernization services that transform critical applications and empower peak performance.
Simplify the AI conversation. Build, scale, and optimize the way your business does AI.
Cut through the complexity of cloud technology and unlock its full potential with multi and hybrid cloud solutions and services.
Unlock collaboration that uplifts your organizations with cloud-based tools from Microsoft and Cisco to bring teams together.
Conquer security compliance complexities with targeted advising and assessment tailored to your company’s unique circumstances.
Consolidate your data management with an actionable plan for your business data.
Leverage DevOps and cloud-native principles to achieve business goals, enhance software delivery, and future-proof infrastructure.
Tailored solutions in Digital Commerce, Digital Marketing and overall Digital Strategy, unlocking your organization’s true potential.
Empowering better business starts with a better, modern data center.
Design a reliable networking solution around the requirements of your organization.
Transition from manual processes to streamlined, automated workflows for managing modern networks
Implement secure, scalable, and repeatable security measures shaped to serve your specific business needs.
Stay ahead of network needs and the competition with tailored optical transport and network infrastructure solutions.
 FEATURED
 FEATURED
 FEATURED
 FEATURED
 FEATURED
 FEATURED
Challenge
The employees of a BlueAlly client experienced inconsistent application performance, notably with file transfers between specific global locations. Productivity suffered as performance fluctuated, which impacted all projects. Detailed analysis revealed the issue was specific to the two sites connected via an internet VPN. Traditional tools failed to pinpoint the problem, necessitating more advanced diagnostics and analysis.
Strategy
BlueAlly decided to implement a WAN diagnostic system that would run continuously to capture evidence of any problems. It had to analyze network performance between servers in data centers at the two sites and the enterprise’s staff endpoints (laptops and tablets). The diagnostics had to capture performance data from the internet to the servers in each data center individually so that we could identify whether the problem was affecting only one data center or both. We also needed to gather data on the performance between staff endpoints and the data centers to identify problems with those network paths.
The diagnosis needed to collect data on paths within and between data centers, from the internet to each data center, and from staff endpoints to data centers. It needed visibility on a hop-by-hop basis. Then, the data had to be correlated between the monitored paths to identify the performance problem’s location.
Solution
BlueAlly worked with several vendors with products capable of decoding modern application delivery chains and chose to build a DX and WAN Monitoring solution using Catchpoint instrumentation.
Catchpoint has lightweight agents loaded on the data center servers and staff endpoints. Catchpoint also has internet-located data collection nodes that could provide visibility into internet performance to each data center and staff endpoints. A cloud-based management system makes configuring all the tests and correlating the results easy.
We started the analysis on a Monday morning and let it run for 48 hours. By Wednesday morning, we had identified significant packet loss every 10-15 minutes on one link within an internet exchange carrier site. The analysis found that Border Gateway Protocol (BGP) network path information changed periodically, and there was high packet loss whenever the path transitioned with one ISP. However, the client’s direct ISP endpoint paths were fine.
The packet loss was upstream from the client’s ISP. Further investigation showed it was tied to BGP interactions (impacting the client’s address space) between upstream providers (with which our client had no contracts or method for enforcement of an SLA).
In the figures below, we are using an example from Catchpoint to ensure privacy for the client. Figure 1 illustrates the view from a number of backbone nodes into a sample data center to illustrate the process.
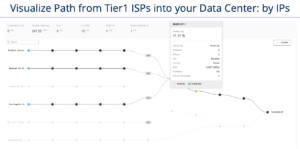
Figure 1
Once we had evidence of the packet drops, we used the tool to take a BGP Autonomous System (AS) view and identified the upstream ISP that was flapping on the client’s IP routes.
Again, for confidentiality reasons, the data shown is just for illustration.
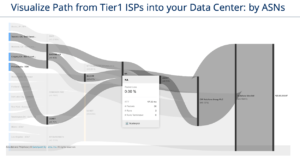
Figure 2
The Results
The DX system permitted cloud-based agents to interrogate the sites in question. Starting the analysis on a Monday and running for 48 hours, significant packet loss every 10-15 minutes was identified at an Internet exchange carrier site, linked to BGP interactions affecting the client’s address space between 2 upstream providers at an Internet Exchange point.
This data was shared with the client’s ISP, who opened a case with their upstream provider. The resolution took several days, but soon after, our client reported the problem was resolved.
The right partner to help you navigate all the systems and network choices is key to your success.